Where should a new data center go if its electricity supply needs to support both growth and sustainability? That was the question behind an Intel-sponsored project I completed through the Global Career Accelerator.
I used Tableau to explore regional generation, demand, and the sources behind that electricity. My recommendation was the Northwest. Getting there meant looking beyond which region produced the most power and asking how much was available, when it was available, and where it came from.
Start with what is left after demand
A large generation total does not tell you how much room a region has for another major electricity consumer. I compared supply and demand alongside net production, then looked at how those relationships changed over time.
The workbook brought those questions into separate views: net production, regional supply and demand, renewable generation, source breakdowns, and hourly changes. I could filter by region and change the time period instead of relying on one national total.
The energy mix changed the recommendation
My analysis identified the Northwest, Central, and California as the leading regions by renewable share. Central and Northwest also had a renewable source as their largest generation source. That made the composition of supply important to the comparison.
I recommended the Northwest because it combined substantial surplus with the highest renewable share in my analysis, around 42%. Its hydropower contribution was another reason to examine it closely. The recommendation weighed available power and its sources together, rather than treating sustainability as a separate chart at the end.
A region is not one constant number
The time-based views helped me inspect changes hidden by annual summaries. I looked at monthly surplus and hourly generation patterns, including the differences between California and the Northwest. The dashboard connected region filters, source selections, and time-period controls so those comparisons could be explored together.
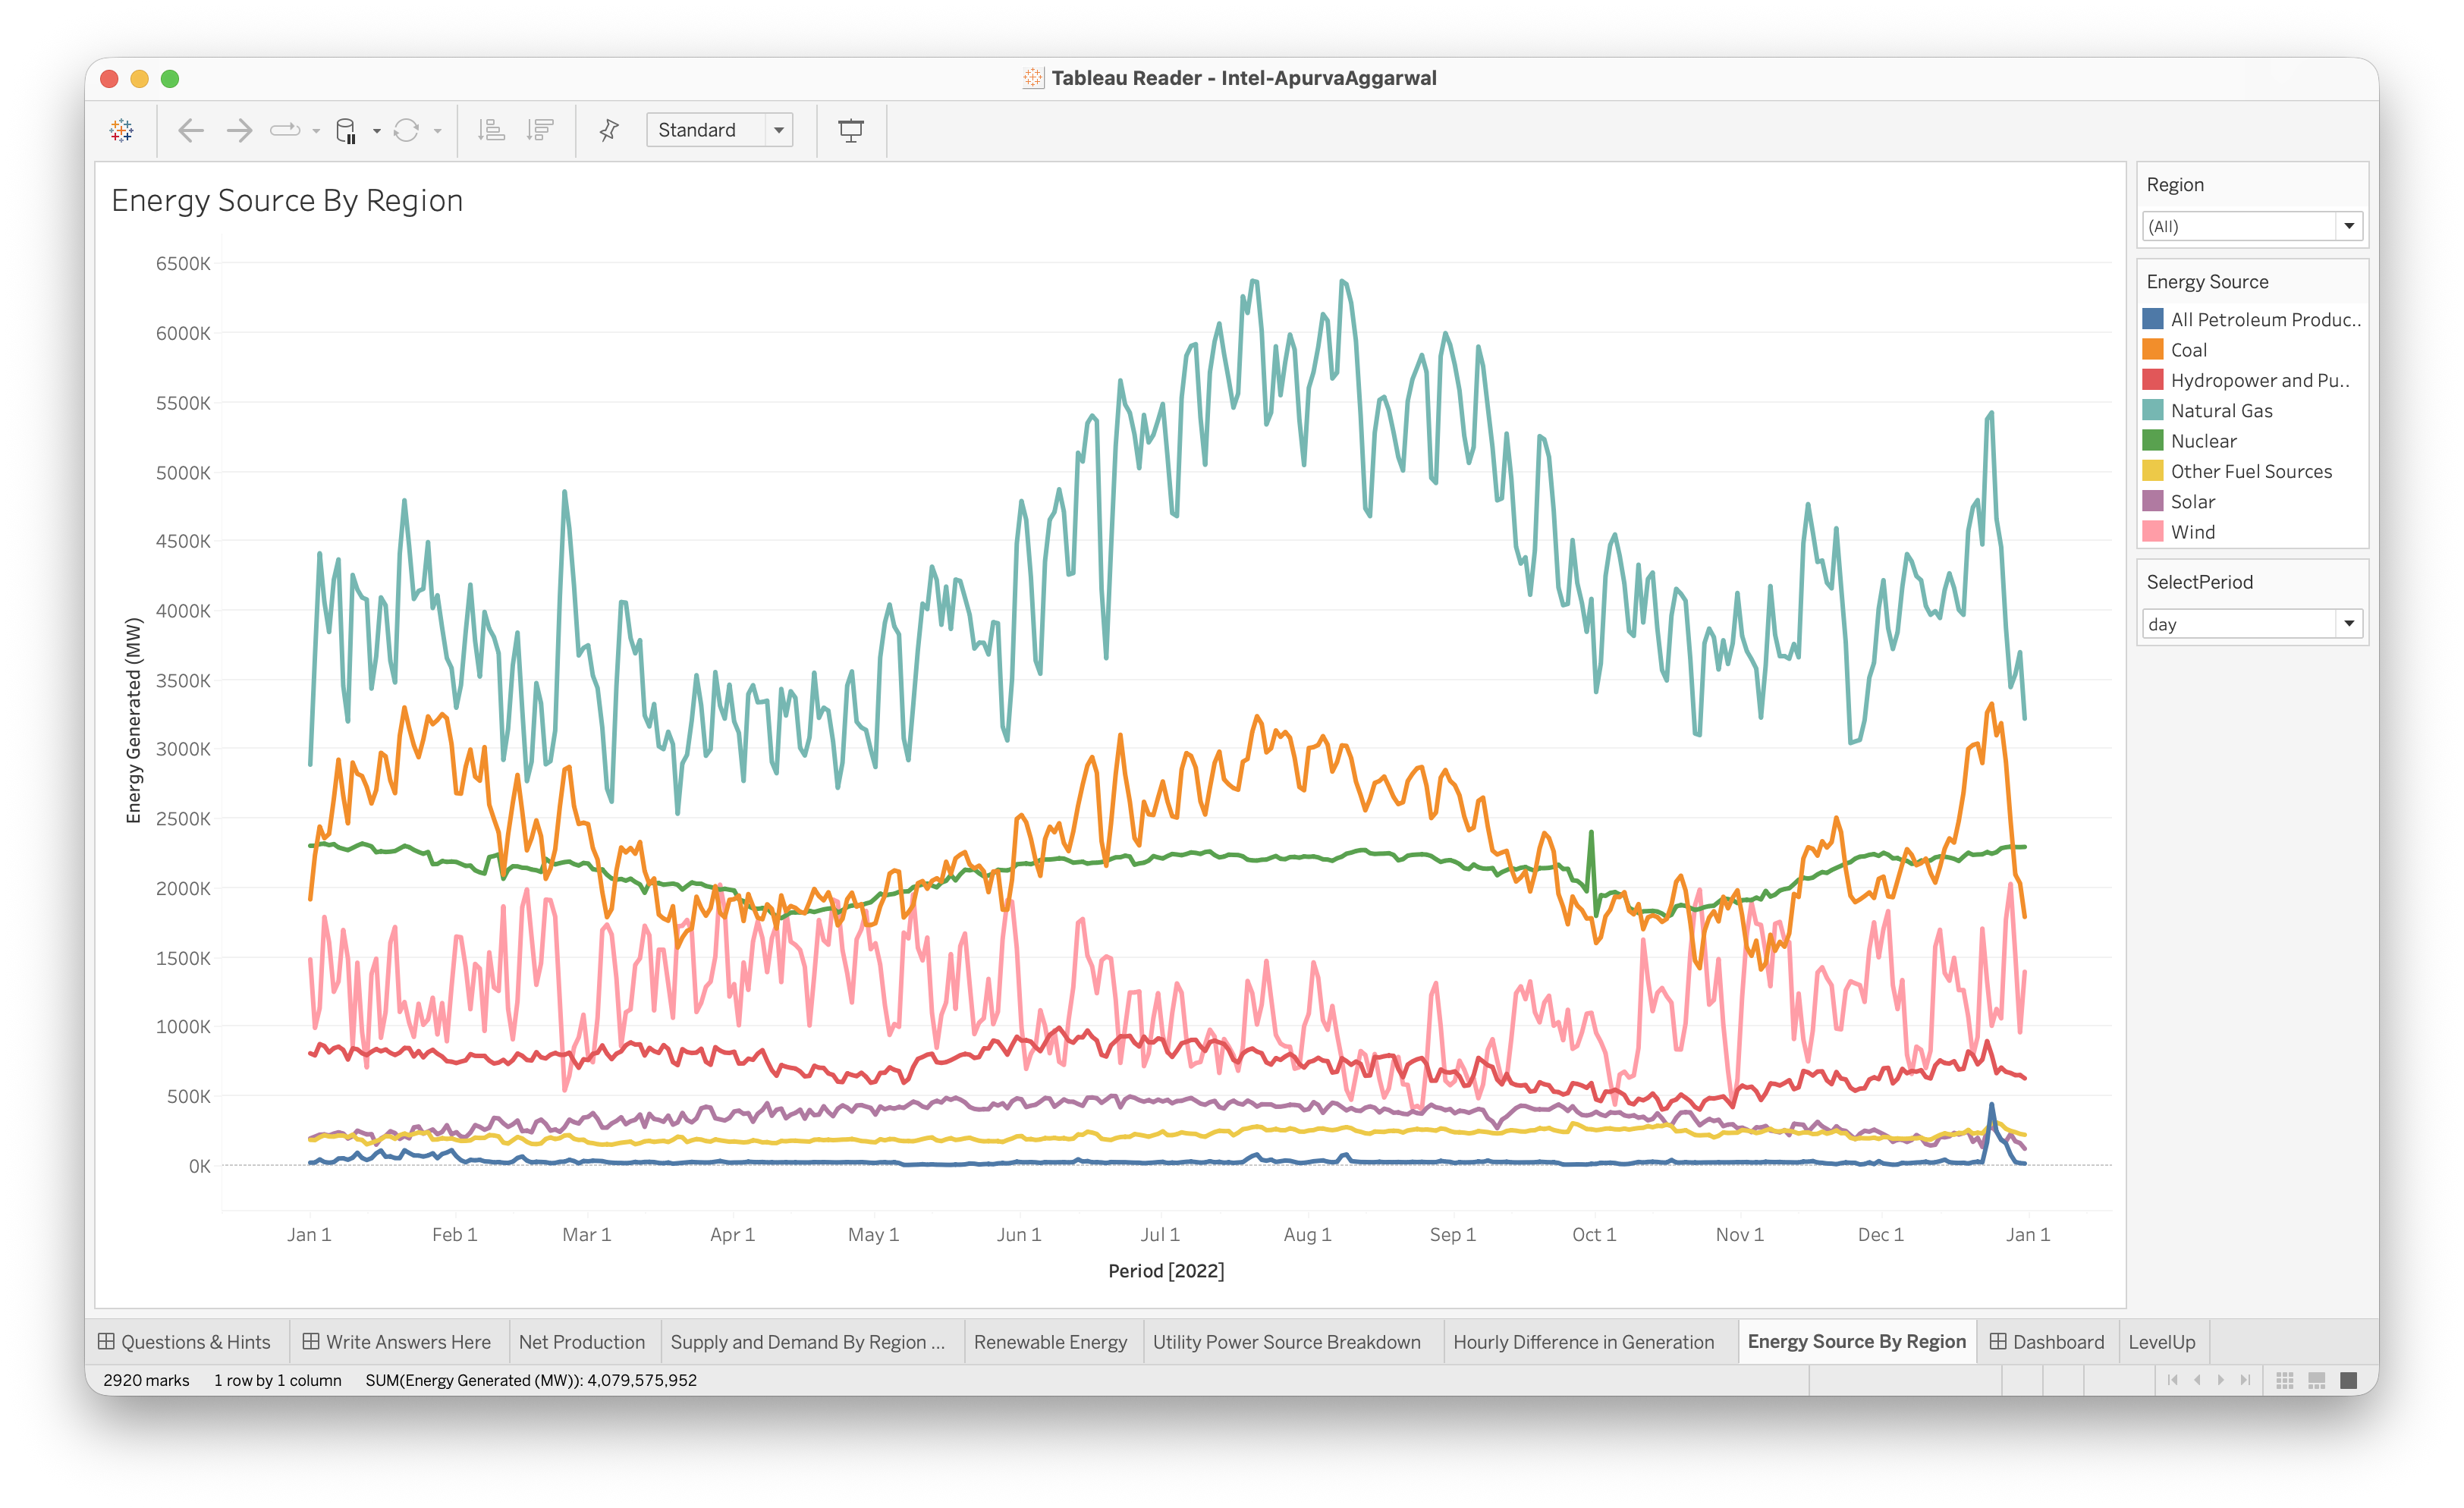
The supplied screenshot shows one of those views: energy generated by source across 2022. Keeping the source lines separate made the changing mix visible instead of flattening everything into a total.
What the analysis could actually decide
This was a sponsored learning project, not a data center siting decision made by Intel. My workbook supported a regional recommendation from the supplied energy data. It did not establish that a particular site had transmission access, permits, contracts, or enough capacity for a specified facility.
The useful lesson was learning to turn several related views into one explainable recommendation. I had to say why the Northwest looked promising and which parts of that conclusion the data could support. That connection between energy data and an operational question is what I still like about the project.
- Tableau
- Energy Data
- Data Visualization